PRESENTED BY THE BENTON INSTITUTE AND THE DOGWOOD HEALTH TRUST
[Headline about Blue Ridge digital equity access]
[sub header: An interactive index and terrain map showing which of the 18 BRBA counties....]
How we measure digital equity
Technology
No broadband subscription · cellular-only · satellite internet
Economy
Below 125% poverty · unemployment · SNAP households
Skills capacity
Age 65+ · head of household education · disability
How to read the scores
100 is the regional baseline for the 18 Alliance counties.
A higher score means greater digital equity challenges. Each county is compared with the others in the region, and the state and the nation play no part. Rank 1 is the county facing the most challenges in the region.
Which counties face the greatest challenges?
Ranked 1 (greatest challenge) to 18. Bars to the right of the line are above the regional baseline. Scores use ACS 2020–2024 five-year estimates.
Explore the maps
Start with the index scores across all 18 counties, then select a county to see how its terrain, coverage and providers shape who can get connected.
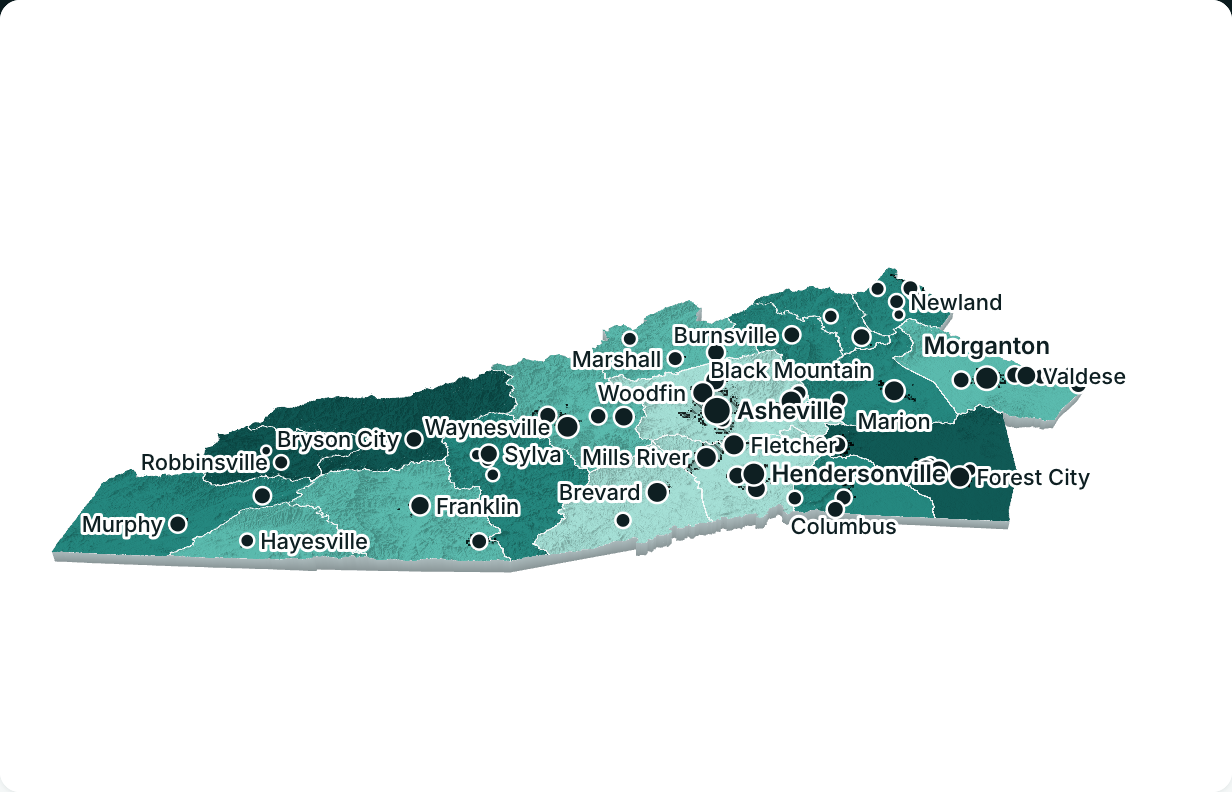
Index scores
Overall, technology, economy and skills scores, county by county.
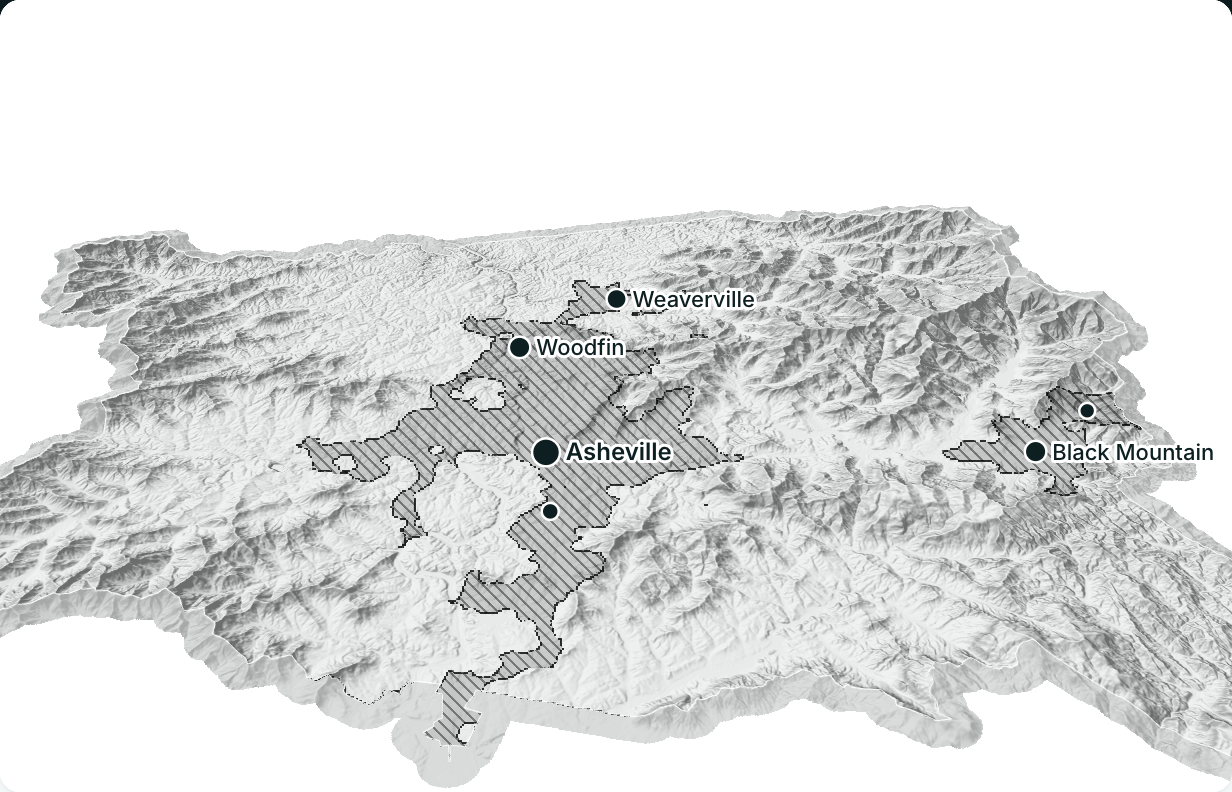
Terrain
The ridgelines, slopes and town edges that shape signal and construction costs.
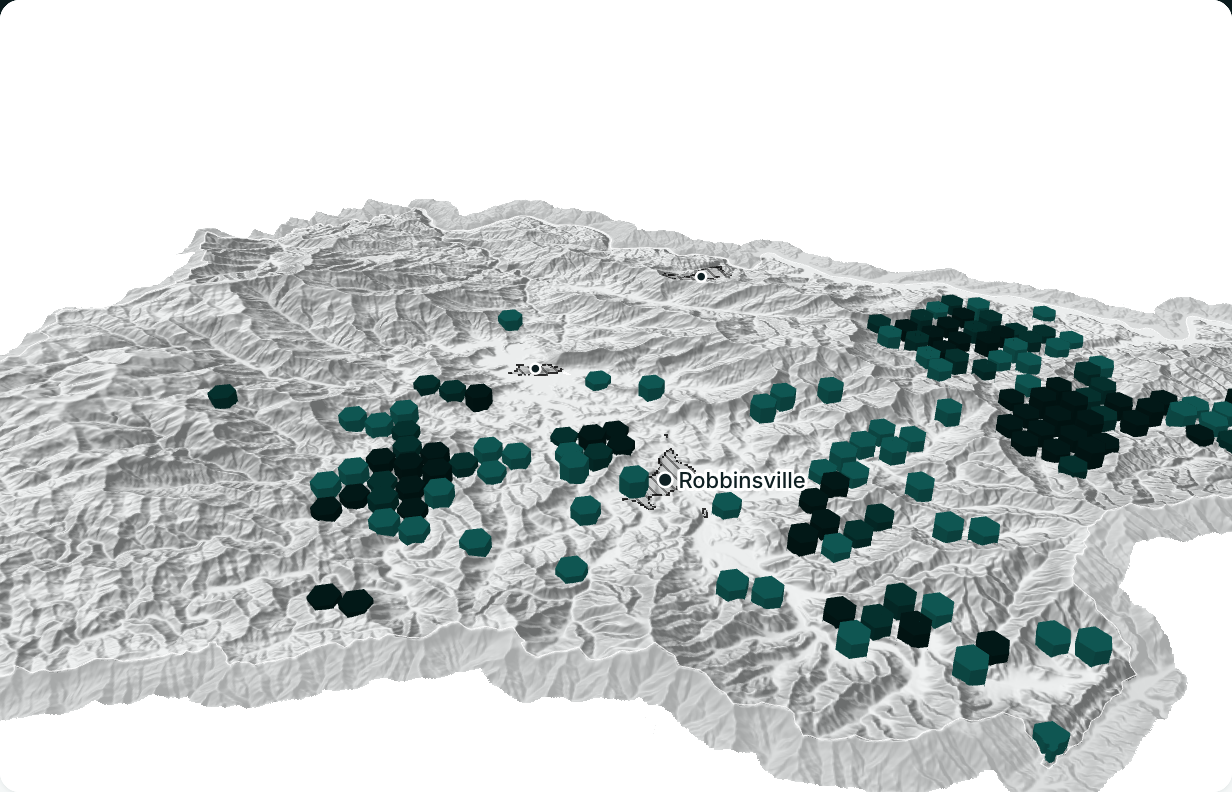
Coverage
Where locations lack service or have no funded build-out.
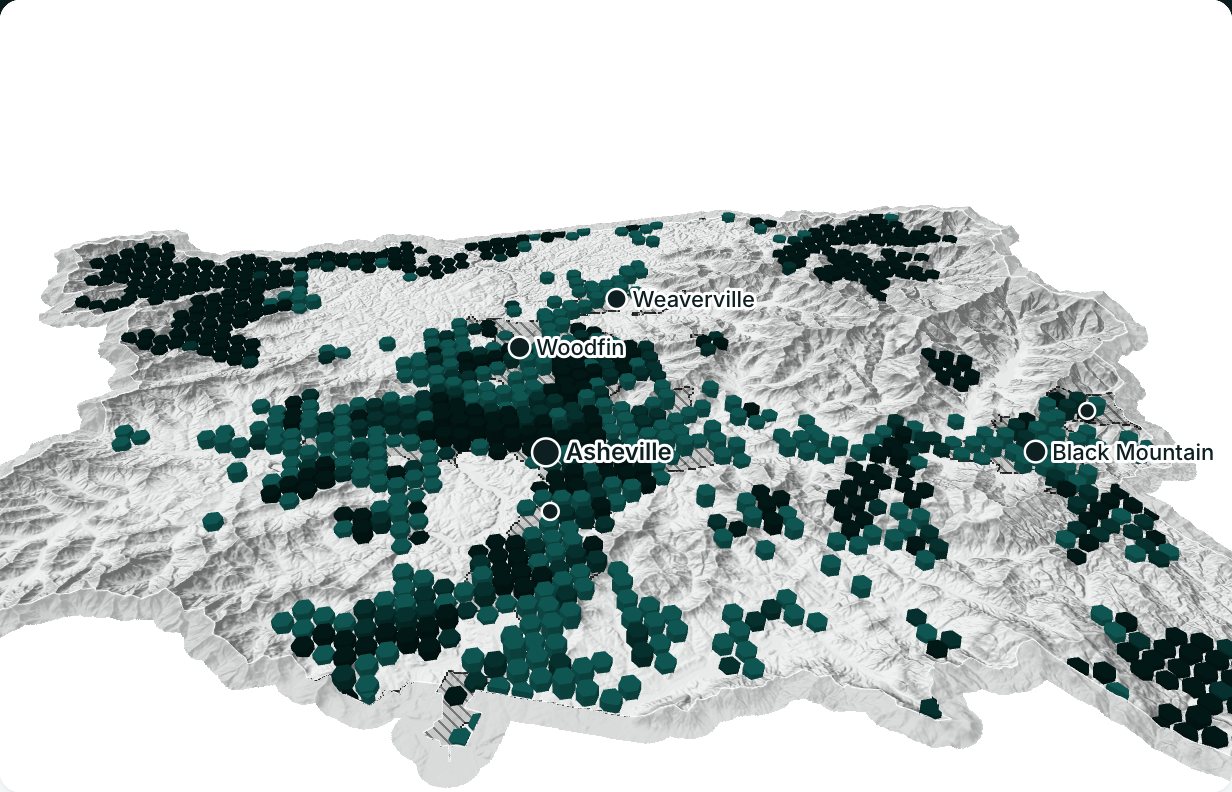
Providers
Which technologies reach each part of the county.